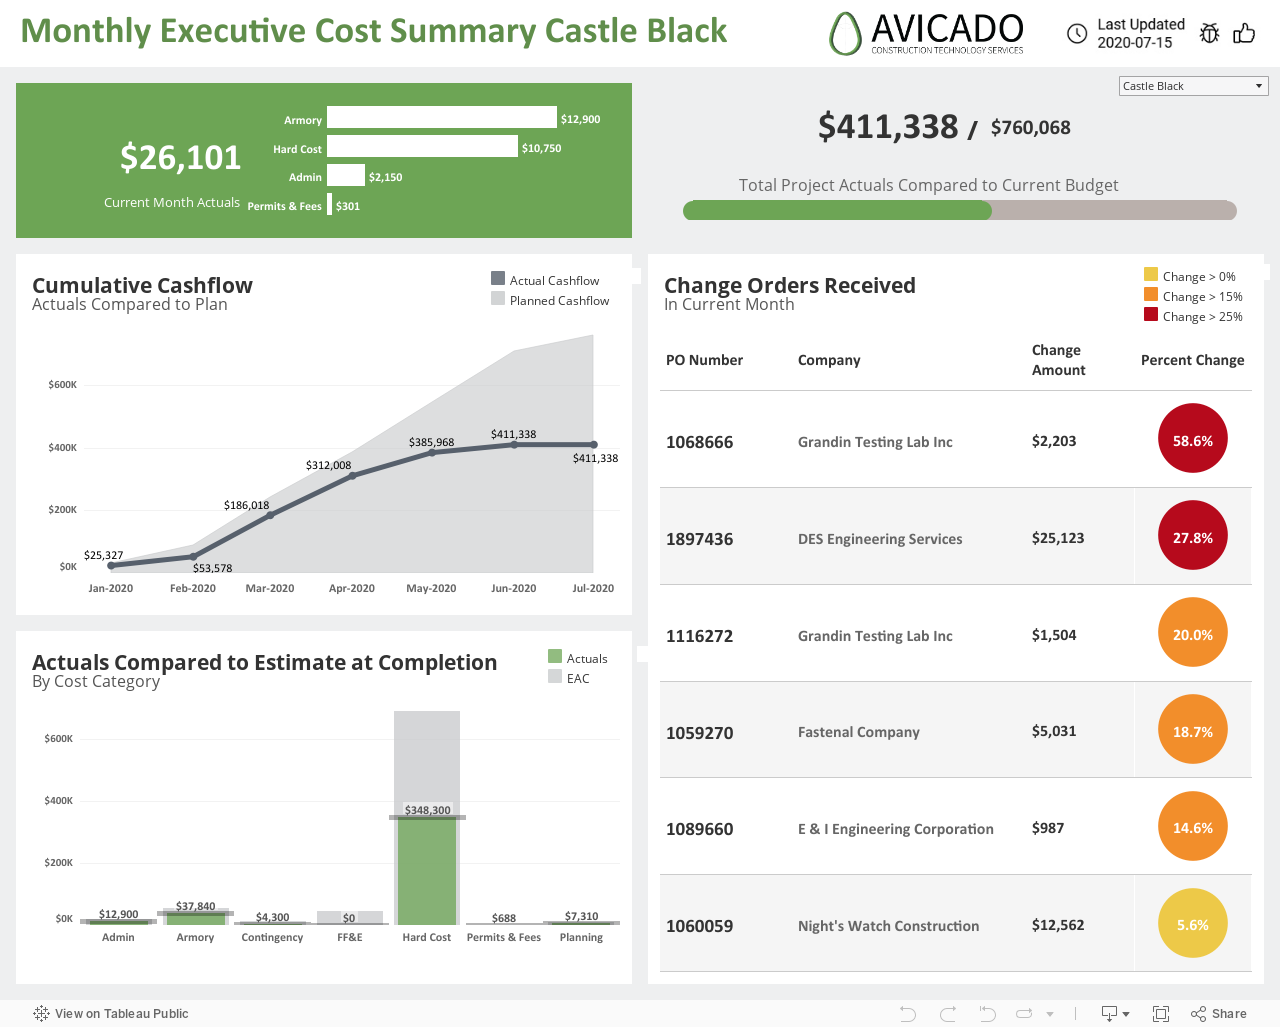
High level financial information – ideal for executive viewing
Clean design with easily identifiable KPIs
Customized change management KPI performance ranges
Customized project logos used as filters
Over 40 e-Builder financial reports all in one dashboard
Dynamic hierarchy allows you to slice and dice the data however you see fit
Designed to be exported as a PDF handout or viewed on a computer
Many project reports can be created quickly simply by changing a filter
Ideal time saving tool for regular project meetings
Highlights a project’s overall health using company defined KPIs
Acts as a central landing page to access other reports & dashboards creating a cohesive reporting ecosystem
KPIs and score ranges can be customized based on program goals and standards
Combines budget and schedule data highlighting relationships between the two
Shows project schedule progress at overall, phase and task/milestone levels
Allows for easy identification of off-track schedule milestones